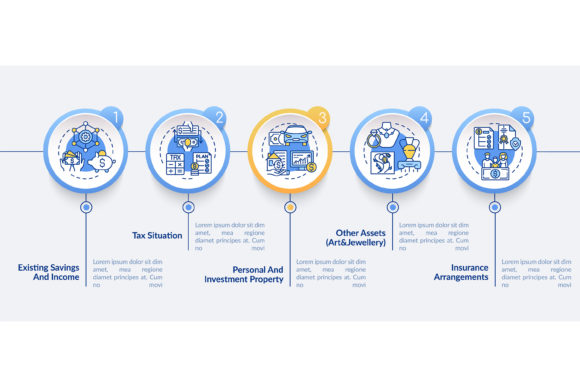
Comprehensive Financial Plan: Visual Guide
A comprehensive financial plan is far more than a simple budget or a savings tracker; it is a holistic roadmap that connects your current reality with your future aspirations. For many adults, the gap between earning money and building lasting wealth feels overwhelming because the strategy exists only in their head. Translating these abstract goals into a tangible visual format changes everything. When you utilize a structured vector infographic template to map out this journey, complex monetary concepts become accessible, actionable, and easy to communicate. This approach transforms intimidating spreadsheets into a clear narrative about property acquisition, art asset management, and long-term security.
Defining the Holistic Strategy
At its core, this type of planning integrates every aspect of your economic life into a single cohesive document. It does not look at investments in isolation from insurance, nor does it separate tax strategies from estate planning. Instead, it views your finances as an interconnected ecosystem. The primary purpose is to provide clarity and confidence. Whether you are a freelancer navigating variable income or a small business owner looking to diversify into real estate, the value lies in seeing the big picture. A well-designed visual layout helps identify blind spots that traditional text-heavy reports often miss. By presenting data through a five-step visualization process, you can instantly recognize where resources are allocated efficiently and where adjustments are necessary to meet specific milestones.
The Five-Step Visualization Process
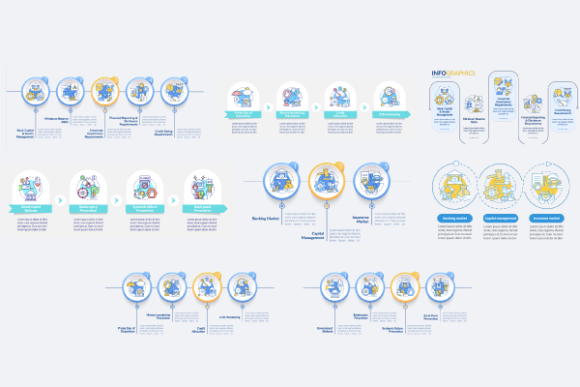
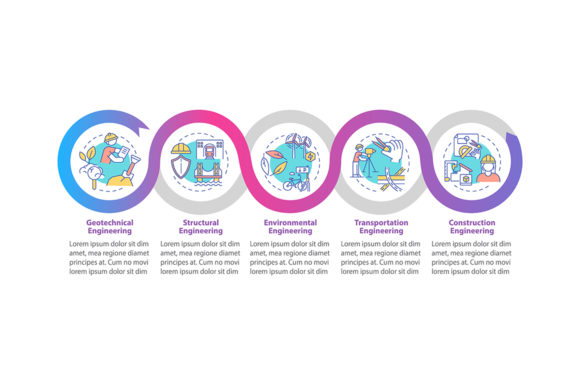
Effective financial communication relies on structure. When using a professional template featuring linear icons and workflow layouts, the planning process typically follows a logical progression that guides the viewer from assessment to execution. This five-step framework ensures no critical element is overlooked:
- Discovery and Assessment: The first step involves gathering all relevant data points, including current assets, liabilities, cash flow, and risk tolerance. In a visual timeline, this appears as the foundation, grounding the rest of the plan in verified facts rather than assumptions.
- Goal Definition: Here, abstract desires transform into SMART objectives. Whether the goal is acquiring a rental property or funding a child’s education, this stage assigns specific timelines and monetary targets to each aspiration.
- Strategy Formulation: This is the engine room of the plan. It outlines the specific vehicles and tactics required to bridge the gap between current status and defined goals. Visual elements here might illustrate asset allocation percentages or debt repayment hierarchies.
- Implementation: A plan without action is merely a wish. This phase details the immediate next steps, such as opening accounts, purchasing insurance policies, or executing property transfers. Linear icons effectively represent these discrete tasks within the broader workflow.
- Monitoring and Review: Financial landscapes shift constantly. The final step establishes a cadence for reviewing progress and adjusting the strategy. A timeline chart visually reinforces that this is a cyclical process, not a one-time event.
Showcasing Property and Art Assets
Standard financial templates often fail to adequately address alternative investments like real estate and fine art. These assets require unique presentation design elements because their value proposition differs significantly from stocks or bonds. A specialized comprehensive financial plan vector infographic template accommodates these nuances by offering dedicated sections for illiquid assets. For entrepreneurs and collectors, this is essential. You need to visualize how a commercial property fits into your overall liquidity profile or how an art collection serves as both a passion investment and a store of value.
When presenting these assets to stakeholders, partners, or family members, aesthetic quality matters. High-resolution design elements convey professionalism and attention to detail. Instead of listing a property’s value in a spreadsheet cell, a visual representation can show its relationship to your net worth, its projected appreciation curve, and its role in your estate plan. This contextualization helps non-experts understand why holding a diverse portfolio that includes tangible assets provides stability during market volatility. The ability to customize these sections ensures that the unique characteristics of each asset class are respected and clearly communicated.
Practical Applications Across Contexts
The versatility of a visual financial plan extends across numerous personal and professional scenarios. Understanding where and how to apply these tools maximizes their utility for different audiences.
For Educators and Coaches: Teaching financial literacy requires simplifying complexity without sacrificing accuracy. Using a process timeline chart allows instructors to break down wealth-building concepts into digestible segments. Students grasp the sequence of financial priorities faster when they can see the workflow laid out visually with intuitive icons.
For Freelancers and Creatives: Irregular income streams make traditional budgeting difficult. A comprehensive visual plan helps map out feast-and-famine cycles, showing exactly when to save surplus income and when to draw from reserves. It turns chaotic cash flow into a predictable pattern, reducing anxiety and enabling better creative focus.
For Small Business Owners: Separating personal and business finances is crucial yet challenging. Visual templates help delineate these boundaries while showing how business profits fuel personal wealth goals. When seeking financing or bringing on investors, presenting a polished, graphic-rich plan demonstrates organizational maturity and strategic foresight.
For Bloggers and Marketers: Content creators discussing finance need engaging visuals to retain audience attention. Customizable vector templates provide professional-grade graphics that enhance articles and social media posts. Rather than using generic stock photos, marketers can present accurate, informative infographics that add genuine value to their content and establish authority.
Technical Considerations for Implementation
Before selecting or utilizing a comprehensive financial plan template, it is vital to consider the technical specifications to ensure long-term usability. File format flexibility is paramount for professionals who need to adapt materials for different platforms. Access to source files like AI (Adobe Illustrator) and EPS allows for deep customization, enabling you to adjust colors, fonts, and layout structures to match your brand identity. Vector formats ensure that graphics remain crisp and scalable whether printed on a large poster for a workshop or displayed on a mobile screen.
For quick sharing and digital presentations, JPG and PNG formats offer compatibility across virtually all devices and software. PNG is particularly valuable for web use due to its support for transparent backgrounds, allowing design elements to integrate seamlessly into existing slide decks or website layouts. SVG files provide the best of both worlds for web applications, offering infinite scalability with minimal file size. Ensuring your template package includes all these formats prevents future bottlenecks when you need to repurpose content for a new medium.
Making Informed Design Choices
While visual appeal is important, accuracy and relevance must drive your design decisions. Avoid templates that prioritize decoration over data integrity. The best comprehensive financial plan vector infographic templates balance aesthetic sophistication with functional clarity. Look for designs where the five-step process flows logically and where linear icons are universally recognizable rather than overly abstract. Remember that the goal is to facilitate understanding, not to impress with artistic complexity.
Additionally, consider the update frequency of your plan. Financial planning is dynamic, and your visual tools should accommodate change easily. Templates with organized layers and editable text fields save significant time during quarterly or annual reviews. If you are managing property or art assets, ensure the template has flexible containers that can handle varying amounts of descriptive text or data points without breaking the layout. Ultimately, the right visual tool acts as a living document that evolves alongside your financial journey, providing continuous guidance and motivation as you work toward your goals.