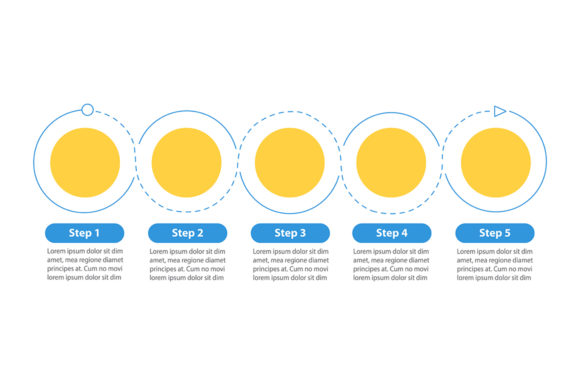
Round Flowchart Infographic Template: A Minimalist Guide to 5-Step Process Visualization
In the realm of professional communication, clarity is often the difference between a message that resonates and one that is ignored. Whether you are presenting a quarterly business review, explaining a complex technical workflow, or creating educational content for social media, the visual structure of your data matters as much as the data itself. The Round Flowchart Infographic Template has emerged as a definitive solution for professionals seeking to balance aesthetic appeal with functional utility. This design asset moves beyond traditional linear diagrams, offering a cyclical, minimalist approach to data visualization that guides the viewer’s eye naturally through a process.
Understanding how to leverage this specific type of template requires more than just downloading a file; it demands an appreciation of visual hierarchy, negative space, and narrative flow. This guide explores the practical applications, structural benefits, and implementation strategies for using a round flowchart vector infographic template in modern design projects.
The Psychology of Circular Data Visualization
Linear timelines suggest a beginning and an end, which is perfect for historical data or project schedules. However, many business processes, biological cycles, and strategic frameworks are continuous. They do not end; they iterate. The Round Flowchart Infographic Template capitalizes on this reality by arranging information in a circular layout. Psychologically, circles represent unity, continuity, and wholeness. When a viewer encounters a round flowchart, they subconsciously understand that the steps presented are interconnected parts of a larger system rather than isolated events.
This format is particularly effective for five-step processes. Five is a cognitive sweet spot; it provides enough detail to be substantive without overwhelming working memory. By distributing these five points evenly around a central axis or along a curved path, designers create a balanced composition that feels stable and professional. The minimalistic style inherent in these templates further enhances comprehension by stripping away decorative noise, allowing the text and icons to take center stage.
Key Design Characteristics and Features
When evaluating a high-quality round flowchart vector infographic template, several distinct features separate professional assets from amateur clip art. These characteristics ensure the template remains versatile across different mediums and industries.
- Minimalist Presentation Elements: Modern audiences have short attention spans. Effective templates utilize flat design principles, muted color palettes, and clean typography. This minimalism ensures that the template acts as a vessel for your content rather than competing with it.
- Generous Copyspace: A common failure in infographic design is the lack of room for actual text. Professional templates prioritize text space within or adjacent to each of the five steps. This allows users to add headlines, brief descriptions, and data points without breaking the layout.
- Vector Scalability: Because these templates are typically provided in vector formats, they can be scaled from a small social media icon to a massive trade show banner without losing resolution. This scalability is non-negotiable for multi-channel marketing campaigns.
- Workflow Layout Logic: The best templates include visual cues—such as arrows, connecting lines, or gradient shifts—that indicate directionality. Even in a circular format, the user must know whether to read clockwise or counter-clockwise.
Practical Applications Across Industries
The versatility of the Round Flowchart Infographic Template makes it a staple in diverse professional environments. Its utility extends far beyond simple decoration; it serves as a functional tool for problem-solving and communication.
Business Strategy and Operations
In corporate settings, circular flowcharts are frequently used to illustrate recurring operational cycles. Examples include the product development lifecycle, customer feedback loops, or agile sprint retrospectives. For instance, a project manager might use a five-step round template to visualize the "Plan, Do, Check, Act" cycle during a stakeholder meeting. The circular nature reinforces the concept of continuous improvement, while the minimalist design keeps the focus on key performance indicators rather than administrative clutter.
Education and E-Learning
Educators and instructional designers rely heavily on visual aids to improve retention. Complex concepts like the water cycle, cellular respiration, or historical eras are naturally cyclical. Using a round flowchart vector infographic template allows educators to break these topics into digestible chunks. The ample copyspace enables the inclusion of definitions or fun facts directly within the diagram, reducing the need for separate handouts and keeping learners engaged with a single, cohesive visual.
Digital Marketing and Content Creation
Social media algorithms favor content that stops the scroll. Infographics consistently outperform plain text posts in engagement metrics. Creators can adapt the five-step process timeline chart for Instagram carousels, LinkedIn articles, or Pinterest pins. By utilizing the PNG or JPG versions included in standard template packages, marketers can quickly deploy high-quality visuals without needing advanced illustration skills. The consistent branding afforded by editable vector files also helps maintain visual identity across campaigns.
Technical Considerations: File Formats and Compatibility
To maximize the value of your design assets, it is crucial to understand the technical specifications typically associated with premium templates. Most comprehensive ZIP files contain four distinct formats, each serving a specific purpose in the production workflow.
- EPS (Encapsulated PostScript): This is the industry-standard source file for print and professional editing. It is fully compatible with Adobe Illustrator, CorelDRAW, and Affinity Designer. EPS files allow for unlimited scaling and complete customization of colors, shapes, and text paths.
- SVG (Scalable Vector Graphics): Essential for web design, SVGs are XML-based vector images that render perfectly on any screen size. They are lightweight, searchable, and can even be animated with CSS. If you plan to embed the flowchart on a website or app, SVG is the superior choice.
- PNG (Portable Network Graphics): A raster format that supports transparency. PNGs are ideal for presentations (PowerPoint/Keynote), documents, and social media where vector editing is not required. The transparent background allows the flowchart to sit cleanly over colored slides or branded backgrounds.
- JPG (Joint Photographic Experts Group): A compressed raster format best suited for quick previews, email newsletters, or platforms that do not support transparency. While less flexible than PNG, JPGs offer smaller file sizes for faster loading times.
Evaluating Suitability for Your Project
While the Round Flowchart Infographic Template is highly adaptable, it is not universally appropriate for every dataset. Before committing to this format, consider the following evaluation criteria to ensure alignment with your communication goals.
Is the process truly cyclical? If your data represents a strict chronological history with a definitive endpoint, a linear timeline may be more honest and easier to interpret. Forcing linear data into a circle can confuse the narrative. Conversely, if your process involves feedback, renewal, or repetition, the round format is ideal.
Do you have exactly five key points? While some templates are modular, most round flowcharts are optimized for odd numbers like three, five, or seven. Five offers the best balance of density and whitespace. If you have ten steps, consider grouping them into five broader categories or selecting a different layout entirely.
Is brevity possible? Circular layouts inherently limit text area due to geometric constraints. If your explanation requires paragraphs of dense copy, a round flowchart will fail. This format demands concise copywriting. Use the template as a summary tool, linking out to detailed documentation elsewhere if necessary.
Best Practices for Customization
Acquiring the template is only the first step. To achieve a truly professional result, adhere to these customization guidelines:
- Maintain Visual Consistency: Ensure that icons used in each of the five steps share the same stylistic weight and line thickness. Mixing photorealistic images with flat line icons creates visual dissonance.
- Use Color Semantically: Don't choose colors randomly. Use color to denote progression or categorization. For example, a gradient shifting from cool blue to warm orange can subtly indicate increasing intensity or maturity in a process.
- Respect the Negative Space: Resist the urge to fill every pixel. Whitespace is an active design element that improves readability. If the template provides copyspace, trust that the designer left it there for a reason.
- Test at Multiple Sizes: Always preview your customized flowchart at the smallest intended display size. Text that looks fine on a 24-inch monitor may become illegible when viewed on a mobile device or printed on a business card.
Conclusion
The Round Flowchart Infographic Template represents a convergence of form and function in modern data visualization. By combining a minimalist aesthetic with a structured five-step workflow layout, it empowers professionals to communicate complex cycles with elegance and precision. Whether delivered via EPS for high-end print production or SVG for responsive web integration, this asset type remains indispensable for creators who value clarity.
Ultimately, the success of any infographic lies not in the template itself, but in the thoughtfulness of its application. By understanding the psychological impact of circular layouts, respecting technical file specifications, and adhering to principles of concise communication, users can transform generic vectors into powerful storytelling tools. In an era of information overload, the ability to present data simply and beautifully is a competitive advantage worth mastering.