Freshwater Contamination: Visualizing the Crisis
Communicating complex environmental data requires more than just statistics; it demands a narrative that resonates visually with your audience. When addressing critical issues like freshwater contamination, the gap between raw scientific data and public understanding can be vast. This is where specialized design assets become indispensable tools for professionals. A high-quality vector infographic template focused on microplastics and water safety transforms abstract chemical concepts into tangible, actionable insights. For marketers, educators, and researchers, these templates are not merely decorative elements but strategic communication devices that bridge the divide between technical accuracy and visual engagement.
The utility of a dedicated freshwater contamination visualization lies in its ability to simplify without dumbing down. Water pollution involves intricate biological and chemical processes that are difficult to explain through text alone. By leveraging structured design elements, you can guide your audience through the lifecycle of pollutants, from source to ecosystem impact. Whether you are preparing a stakeholder presentation, an educational module, or a social media awareness campaign, having a pre-structured layout ensures your message remains consistent, professional, and scientifically grounded.
Core Design Elements and Technical Specifications
Effective environmental infographics rely on specific design architectures to convey urgency and clarity. The most valuable templates for this niche incorporate three distinct structural components that address different aspects of the freshwater contamination narrative. Understanding these elements helps you select the right asset for your specific project needs.
Data Visualization with Three Steps
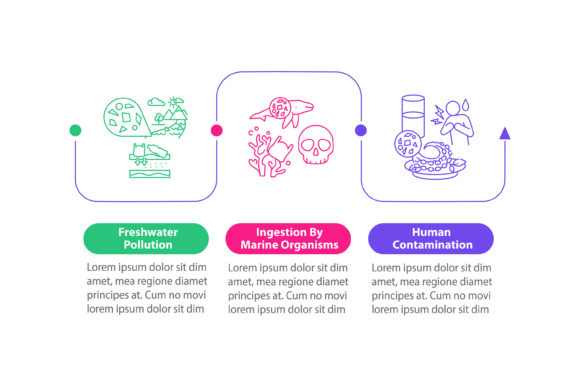
The "three-step" data visualization model is particularly effective for illustrating the progression of microplastic degradation or filtration efficiency. In the context of freshwater systems, this often translates to a logical flow such as Source, Transport, and Accumulation. This tripartite structure prevents cognitive overload by breaking down massive datasets into digestible chunks. For a presenter, this means you can pause at each stage to elaborate on specific metrics without losing the audience's thread. Design-wise, look for templates that use distinct color coding or iconography for each step to reinforce the separation of phases while maintaining visual cohesion.
Process Timeline Charts
Contamination is rarely a static event; it is a temporal process. A process timeline chart is essential for showing the long-term effects of pollutants in freshwater ecosystems. Unlike a simple linear list, a well-designed timeline integrates chronological markers with visual indicators of ecological health. This element is crucial when discussing bioaccumulation or policy implementation schedules. When evaluating a template, ensure the timeline is flexible enough to accommodate varying time scales, from immediate spill responses to decadal climate impact studies. The best templates allow you to adjust node spacing and label positioning without distorting the overall aesthetic.
Workflow Layouts with Linear Icons
For technical audiences or operational briefings, workflow layouts provide a systematic view of water treatment or contamination pathways. Linear icons serve as universal signifiers that transcend language barriers, making them ideal for international reports or diverse classrooms. These icons should be stylistically consistent—thin-line or flat design styles typically work best for serious environmental topics as they convey precision and modernity. A strong workflow layout connects these icons with directional flows, clearly indicating causality and sequence. This is particularly useful when explaining how microplastics enter the food web or how remediation technologies function within a municipal water system.
Practical Applications Across Professional Sectors
The versatility of freshwater contamination vector templates extends far beyond academic research. Different professional environments require distinct adaptations of these visual tools to meet their unique objectives and audience expectations.
- Educational Institutions: Teachers and professors use these infographics to anchor lectures on environmental science. The visual nature aids memory retention for students learning about hydrology and toxicology. Editable vectors allow educators to update data annually without redesigning the entire slide deck.
- Environmental NGOs and Advocacy: Non-profits rely on emotional connection backed by facts. Infographics turn dry monitoring reports into compelling fundraising or advocacy materials. The visual hierarchy directs attention to key statistics that drive donor action or policy support.
- Corporate Sustainability Reporting: Businesses involved in manufacturing, agriculture, or utilities must demonstrate compliance and stewardship. Professional-grade templates ensure that ESG (Environmental, Social, and Governance) reports look polished and credible, avoiding the amateurish appearance that can undermine trust.
- Digital Content Creators: Bloggers and social media managers need assets that stop the scroll. Adapting these templates into square or vertical formats for Instagram and LinkedIn helps translate complex freshwater issues into shareable, bite-sized content that boosts engagement and authority.
Selecting the Right File Format for Your Workflow
One of the most practical considerations when acquiring design assets is file compatibility. Freshwater contamination templates typically come in a suite of formats including JPG, EPS, PNG, SVG, and AI. Choosing the correct format is not just about convenience; it impacts your production efficiency and final output quality.
AI and EPS files are the industry standards for print and large-format display. As vector-based formats, they are infinitely scalable without pixelation. If you are designing a conference banner, a museum exhibit panel, or a detailed printed report, these are non-negotiable. They also retain editable layers, allowing you to change colors, swap icons, or adjust text to match your brand guidelines precisely. Adobe Illustrator is the primary software for these, though CorelDRAW and Affinity Designer offer compatibility.
SVG files have become the gold standard for digital-first projects. Because they are code-based vectors, they render crisply on any screen resolution and can be animated with CSS or JavaScript. For interactive web articles about freshwater contamination or responsive dashboards, SVG offers superior performance compared to raster images. They also contribute to better SEO and accessibility when properly tagged.
PNG and JPG files serve as quick-reference assets. While they lack editability, they are universally compatible and require no specialized software. These are ideal for embedding in PowerPoint presentations, Word documents, or email newsletters where vector support is limited. However, always ensure you download high-resolution versions (300 DPI for print, 72+ DPI for screens) to avoid the unprofessional blur associated with low-quality compression.
Enhancing Communication Through Visual Consistency
Beyond individual file types, the true value of these templates emerges when used as part of a cohesive visual system. Freshwater contamination is a multifaceted topic, and your audience will encounter your visuals across multiple touchpoints. Maintaining consistency in color palettes, typography, and icon style builds recognition and trust. When stakeholders see the same visual language in your annual report, website, and conference booth, it reinforces organizational competence.
Consider the psychological impact of color in environmental design. Blues and greens are traditional associations with water and nature, but overuse can lead to visual fatigue or cliché. Strategic use of accent colors—such as muted reds or oranges to indicate contamination hotspots—creates focal points that guide the viewer’s eye to critical data. A well-designed template provides these color relationships out of the box, saving you hours of color theory experimentation.
Furthermore, the integration of microplastics-specific imagery distinguishes generic water templates from specialized resources. Look for designs that accurately depict particle sizes, filtration meshes, or biological ingestion rather than generic water droplets. Specificity signals expertise. When your audience recognizes that the visual representation matches the scientific reality of freshwater contamination, your credibility increases significantly. This attention to detail is what separates professional-grade communication from superficial content marketing.
Ultimately, investing in high-quality vector infographic templates is an investment in clarity. In a field where misinformation spreads easily and attention spans are short, the ability to present accurate, compelling visual narratives about freshwater contamination is a competitive advantage. By selecting assets with robust structural elements, appropriate file formats, and scientific accuracy, you empower yourself to communicate more effectively, whether you are teaching a class, pitching investors, or advocating for cleaner waterways.