Strategic Communication with Infographic Template V.7: A Framework for Visual Clarity
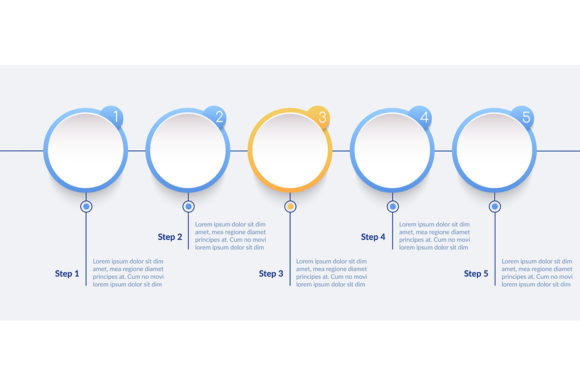
Effective visual communication is rarely about decoration; it is about reducing cognitive load and accelerating decision-making. Infographic Template V.7 serves as a structural framework designed to organize complex information into digestible, actionable insights. For professionals ranging from marketers and educators to entrepreneurs and operations managers, this template offers more than aesthetic appeal. It provides a pre-validated hierarchy that guides the viewer’s eye through data, processes, or strategic narratives without unnecessary friction. When utilized within the included 16:9 aspect ratio, it aligns perfectly with modern presentation standards, video backgrounds, and digital report formats, ensuring your message retains integrity across platforms.
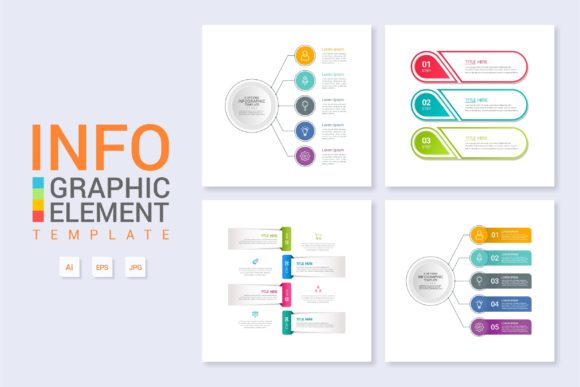
The strategic value of Infographic Template V.7 lies in its ability to enforce discipline in storytelling. Rather than starting with a blank canvas and risking inconsistent spacing or poor typographic contrast, users inherit a system built on grid-based precision. This allows you to focus entirely on content strategy and data accuracy. The package includes an Illustrator CC file and an EPS 10 file, ensuring compatibility across different software versions and workflows, alongside a Preview JPEG for quick reference. This technical flexibility supports long-term operational efficiency, allowing teams to maintain brand consistency while adapting the vector assets for diverse use cases.
Aligning Visual Structure with Business Objectives
Before opening the Illustrator CC file, it is essential to define the specific outcome you intend to achieve. Infographic Template V.7 is a vessel for information, but its effectiveness depends entirely on the clarity of your underlying message. Professionals often make the mistake of selecting a template based solely on visual preference rather than functional fit. To avoid this, map your content goals directly to the template’s modular sections.
- Process Optimization: If your goal is to explain a workflow or standard operating procedure, utilize the linear progression elements within the template to visualize bottlenecks and handoffs.
- Data Comparison: For market analysis or competitive positioning, leverage the chart-ready vector shapes to create immediate visual distinctions between datasets.
- Educational Scaffolding: Educators and trainers can use the hierarchical layout to break down abstract concepts into sequential learning modules, improving retention rates.
- Stakeholder Reporting: Executives require high-level summaries. Use the prominent header and key metric zones in the 16:9 layout to deliver executive briefings that respect time constraints.
By anchoring your design work in these objectives, Infographic Template V.7 transitions from a graphic asset to a strategic tool. The editable text and vector components allow for rapid iteration, meaning you can test different narrative structures without rebuilding the foundation. This agility is particularly valuable for freelancers and agencies managing multiple clients, where speed and quality must coexist.
Technical Versatility and Workflow Integration
The inclusion of both Illustrator CC and EPS 10 files addresses a common friction point in professional environments: software fragmentation. While creative teams may operate on the latest Adobe Creative Cloud subscriptions, external partners, print vendors, or legacy systems often require broader compatibility. The EPS 10 format ensures that the vector integrity of Infographic Template V.7 remains intact regardless of the environment. This future-proofs your investment and prevents technical debt from accumulating in your asset library.
The 16:9 aspect ratio is specifically chosen for contemporary digital ecosystems. Unlike vertical infographics designed primarily for Pinterest or mobile scrolling, the 16:9 format dominates business communication. It fits natively into PowerPoint and Keynote slides, serves as an ideal thumbnail for YouTube or Vimeo content, and displays optimally on widescreen monitors during virtual meetings. When planning your content calendar, consider how Infographic Template V.7 can serve multiple channels simultaneously. A single well-executed infographic can function as a slide in a pitch deck, a standalone blog feature, and a downloadable lead magnet, maximizing the return on the time invested in customization.
Editing with Intention: Best Practices for Vector Assets
Having editable text and vectors is a feature, but maintaining design integrity during editing is a skill. When modifying Infographic Template V.7, adhere to the following principles to preserve professional quality:
- Respect the Grid: The template’s alignment is not accidental. When adding new elements or resizing existing ones, keep Smart Guides enabled in Illustrator to snap objects to the established baseline. Drifting from the grid creates subconscious perceptions of sloppiness.
- Maintain Typographic Hierarchy: The template uses specific font weights and sizes to signal importance. When replacing placeholder text, avoid arbitrarily changing sizes. If your content requires a new level of emphasis, adjust the entire system proportionally rather than tweaking individual text boxes.
- Color as Function: Use color to encode meaning, not just to match brand palettes. Assign specific hues to categories or data types consistently throughout the infographic. This reduces the mental effort required for viewers to interpret legends and keys.
- Vector Scalability: Because the assets are true vectors, they can be scaled indefinitely without pixelation. However, ensure that stroke weights and text sizes remain legible at smaller display sizes. Test the Preview JPEG at actual viewing dimensions before finalizing.
Mitigating Risks in Template-Based Design
While Infographic Template V.7 accelerates production, reliance on templates carries inherent risks if approached without critical thinking. The most significant danger is forcing unique data into generic containers. If your dataset has five distinct categories but the template highlights three primary columns, do not artificially compress your information to fit the layout. Instead, adapt the vector structure or select a different configuration within the file. Misrepresenting data to suit a design undermines credibility and violates core principles of information integrity.
Another risk is visual homogeneity. Because templates are accessible to many users, there is a possibility of audience fatigue. Counteract this by deeply customizing the aesthetic layer. Adjust the color grading, introduce custom iconography, or integrate proprietary photography. The goal is to use Infographic Template V.7 as a skeleton, not a skin. Your unique value proposition should be evident in the content and styling, even if the underlying geometry is shared.
Additionally, avoid the trap of complexity creep. Templates often include numerous decorative elements to showcase versatility. In practice, less is frequently more. Audit every element in your composition against your stated objective. If a graphical flourish does not aid comprehension or reinforce branding, remove it. White space is an active component of design that facilitates processing; filling it simply because the template allows it dilutes impact.
Strategic Planning Before Execution
To maximize the utility of this package, invest time in pre-production planning. Create a content outline that mirrors the template’s flow before beginning design work. Identify your key message, supporting evidence, and desired call to action. Review the Preview JPEG to visualize how your outlined content maps to the available real estate. This step prevents the frustrating cycle of redesigning layouts mid-project because the narrative structure was incompatible with the visual container.
For teams, establish usage guidelines for Infographic Template V.7. Define which colors correspond to which data types, specify approved fonts for body copy versus headers, and document how to handle overflow text. Standardizing these decisions transforms the template from a one-off asset into a scalable communication system. This is particularly relevant for organizations producing regular reports, newsletters, or training materials where consistency builds trust and recognition over time.
Long-Term Value and Asset Management
Viewing Infographic Template V.7 as a long-term resource rather than a disposable project file changes how you interact with it. Save customized master versions for recurring use cases. If you produce quarterly financial updates, create a dedicated master file with your color scheme, logo placement, and standard disclaimers already configured. This reduces setup time for future iterations and minimizes the risk of version control errors.
The vector nature of the EPS 10 and Illustrator CC files also enables component extraction. Individual charts, icons, or layout blocks from Infographic Template V.7 can be saved as separate symbols or libraries for use in other documents. This modularity extends the value of the package far beyond its original scope, providing a consistent visual language across brochures, web graphics, and social media assets. Over time, this systematic approach to visual assets compounds, creating a cohesive brand experience that feels intentional and professional.
Ultimately, the decision to use Infographic Template V.7 should be driven by a commitment to clarity and efficiency. It is a tool for professionals who understand that good design is invisible—it simply makes the message easier to receive. By combining the technical robustness of editable vectors with a strategic approach to content planning, you transform a standard template into a competitive advantage. Whether you are explaining a complex product, teaching a difficult concept, or persuading stakeholders, the structured flexibility of this 16:9 vector package provides the foundation necessary to communicate with confidence and precision.