Civil Engineering Expert Worker Visual Assets
Communicating complex infrastructure projects requires more than just technical drawings; it demands clear, accessible visual storytelling. The Civil Engineering Expert Worker vector infographic template serves as a bridge between raw engineering data and stakeholder understanding. This resource is designed specifically for professionals who need to translate site workflows, safety protocols, and construction phases into polished presentations without spending hours on custom illustration. By utilizing pre-structured architectural presentation design elements, you can maintain technical accuracy while achieving a high level of aesthetic professionalism.
The core value of this asset lies in its modularity. Unlike static stock photos, these vector-based templates allow for complete customization. Whether you are preparing a bid proposal, an educational lecture, or a client progress report, the ability to edit colors, scale icons, and rearrange layout components ensures that the final output aligns perfectly with your specific project identity. The inclusion of multiple file formats—EPS, JPG, PNG, and SVG—in the ZIP package guarantees compatibility across industry-standard software like Adobe Illustrator, web platforms, and office presentation suites.
Visualizing Construction Workflows Effectively
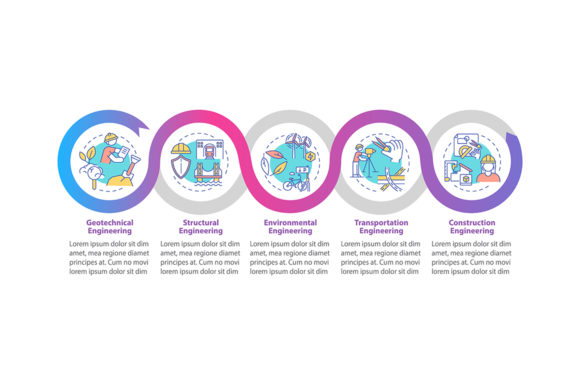
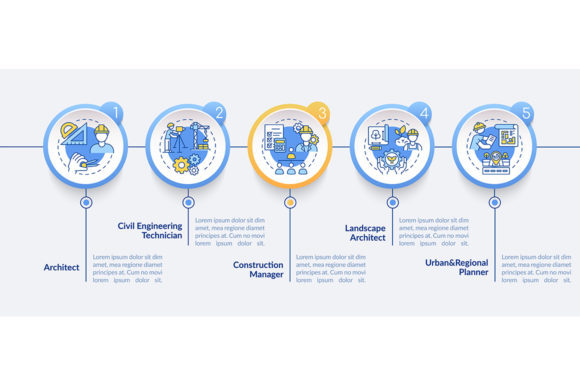
One of the most challenging aspects of civil engineering communication is explaining sequential processes to non-technical audiences. The data visualization with 5 steps component included in this template addresses this directly. Rather than presenting a dense wall of text regarding project milestones, you can map out critical phases such as site surveying, foundation laying, structural framing, systems installation, and final inspection. This structured approach helps clients visualize the trajectory of their investment and sets realistic expectations for project delivery.
When implementing this five-step framework, focus on clarity over decoration. Each step should be represented by a distinct linear icon paired with concise typography. For example, if you are detailing a road rehabilitation project, use the workflow layout to distinguish between demolition, grading, paving, marking, and landscaping. The linear icon style provided in the template is intentionally minimalist to prevent visual clutter. This restraint allows the viewer’s eye to move naturally from one stage to the next, reinforcing the logical progression of the engineering work. Consistency in stroke weight and color palette across all five steps is essential for maintaining a cohesive narrative.
Adapting the Process Timeline Chart
Time management is central to civil engineering, and the process timeline chart offers a versatile method for displaying schedules. However, a timeline should not merely be a Gantt chart replica. Use this graphic element to highlight dependencies and critical path items visually. For marketing agencies working with construction firms, this chart can be repurposed to show the "journey" of a development project for investor decks. Educators can adapt the same timeline to teach students about historical infrastructure developments or the lifecycle of sustainable materials.
The flexibility of the SVG and EPS formats means you can extend or condense the timeline without losing resolution. If a project has seven distinct phases instead of five, simply duplicate and adjust the spacing of the timeline nodes. Conversely, if you need a high-level overview for an executive summary, you can group detailed tasks into broader categories. This adaptability makes the Civil Engineering Expert Worker template a long-term asset rather than a single-use graphic. Always ensure that time markers are legible and that the flow direction matches the reading pattern of your target audience, typically left-to-right for Western contexts.
Architectural Presentation Design Elements
Beyond process flows, the template includes specific architectural presentation design elements that elevate the overall look of your documentation. These include stylized human figures, equipment silhouettes, and structural overlays that add scale and context to technical plans. When presenting to city councils or community boards, adding these human-centric elements helps stakeholders relate to the physical reality of the proposed structure. It transforms abstract blueprints into livable spaces.
For freelancers and small business owners, these design elements provide a shortcut to professional branding. Instead of hiring an illustrator for every new proposal, you can build a library of consistent visual assets derived from this template. Mix the expert worker vectors with your own site photography to create hybrid visuals that feel both grounded and polished. Ensure that the opacity and color grading of the vector elements match your photographic backgrounds to avoid a disjointed appearance. This attention to detail signals competence and thoroughness to prospective clients.
Creative Applications Across Industries
While rooted in civil engineering, the utility of this template extends to adjacent fields. Safety trainers can utilize the expert worker vectors to create engaging toolbox talk materials or OSHA compliance posters. Real estate developers might use the workflow layouts to explain renovation timelines to property buyers. Content creators and bloggers focusing on urban planning can leverage the infographics to illustrate articles about smart cities or sustainable infrastructure. The key is to interpret the "expert worker" not just as a construction laborer, but as a symbol of skilled execution and professional oversight.
Educators and academic researchers will find the data visualization components particularly useful for publishing papers or creating lecture slides. Complex methodologies regarding soil mechanics or hydrology can be simplified using the linear icon system. By standardizing these visuals, you make dense information more digestible for students and peers alike. Remember to cite or attribute the template usage according to licensing terms when publishing publicly, maintaining ethical standards in professional design.
Technical Best Practices for Implementation
To maximize the effectiveness of the Civil Engineering Expert Worker assets, adhere to a few technical best practices. First, always work in the native EPS or SVG format when making edits. Rasterizing to JPG or PNG should only be the final step before export. This preserves the crisp edges necessary for large-format printing on site banners or presentation boards. Second, establish a color hierarchy before you begin designing. Assign specific colors to different types of information—such as blue for structural elements, orange for safety warnings, and green for environmental considerations—and apply them consistently throughout the infographic.
- Layer Organization: Keep your source files organized by grouping related elements. Separate icons, text, and background shapes into distinct layers to streamline future updates.
- Typography Pairing: Match the clean lines of the vector art with sans-serif typefaces. Avoid decorative fonts that compete with the technical nature of the imagery.
- White Space Management: Do not fill every available pixel. Adequate negative space improves readability and gives the design a modern, uncluttered feel.
- Accessibility Checks: Ensure sufficient contrast between text and background colors. Add alt-text descriptions when using the PNG or JPG versions on websites.
Consistency is the hallmark of professional engineering communication. When using the workflow layout with linear icons, verify that the stroke width remains uniform even if you resize individual elements. Disproportionate icons can subconsciously suggest a lack of precision. Similarly, align text blocks rigorously to a grid. These subtle details contribute to an overall impression of reliability and expertise. The template provides the foundation, but your adherence to design discipline determines the final quality.
Optimizing for Different Platforms
Different platforms require different approaches to the same content. A detailed process timeline chart suitable for a printed A3 report may be illegible on a mobile screen. When adapting the Civil Engineering Expert Worker template for social media or web use, consider breaking the five-step visualization into a carousel post or an animated sequence. Use the PNG exports with transparent backgrounds to overlay graphics onto video content or interactive web pages. For LinkedIn articles or industry blogs, the JPG format offers a balance of quality and load speed.
Marketers should test variations of the infographic to see which resonates best with their audience. Does a horizontal timeline perform better than a vertical one? Do annotated photos outperform pure vector illustrations? Use the modular nature of the ZIP file contents to rapidly prototype these variations. The goal is to find the most effective way to convey technical authority and project capability. By treating these design assets as flexible tools rather than rigid templates, you unlock their full potential to support diverse business and creative objectives.
Ultimately, the Civil Engineering Expert Worker vector infographic template is about efficiency and clarity. It empowers users to produce high-quality visual content that respects the complexity of the field while remaining accessible to laypeople. Whether you are documenting a massive infrastructure project or teaching the fundamentals of construction management, these resources provide a solid starting point. Invest time in learning the layer structure and customization options, and you will find that this single download can serve countless future projects with distinction and professional polish.