Evaluating Infographic Elements Design for Professional Visual Workflows
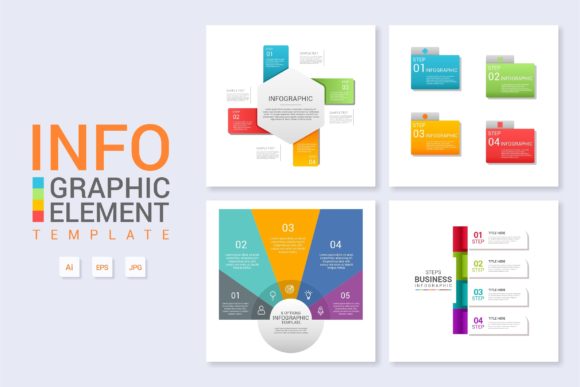
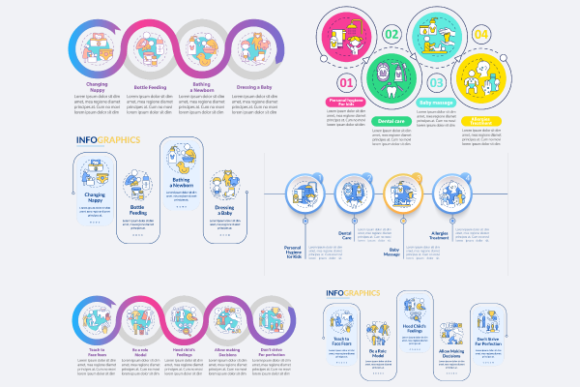
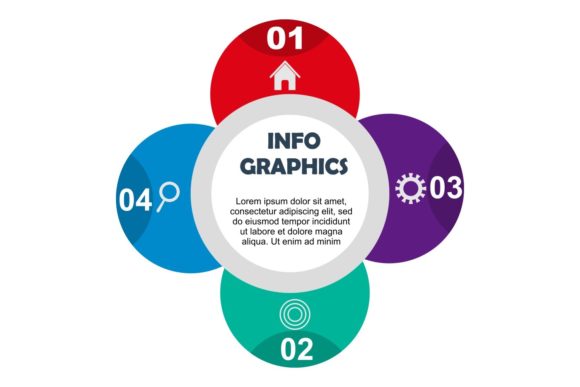
In the landscape of digital communication, the ability to visualize complex data quickly is often more valuable than the data itself. For professionals ranging from marketing directors to freelance educators, the bottleneck is rarely a lack of information but rather the time required to translate that information into a digestible visual format. This is where a comprehensive collection like Infographic Elements Design becomes a critical workflow asset. Rather than viewing this merely as a pack of decorative graphics, it is more accurate to evaluate it as a modular design system intended to bridge the gap between raw statistics and audience comprehension. The true value lies not just in the aesthetic appeal of the 100 vector shapes included, but in the structural flexibility they offer to users who need to maintain brand consistency while adapting to diverse content requirements.
Technical Flexibility and Color Adaptation
The most significant friction point in using pre-made design assets is usually color matching. A beautiful infographic element becomes useless if it clashes with established brand guidelines or requires hours of manual recoloring. The primary strength of this specific Infographic Elements Design collection is its architecture for easy color changes. Because the files are true vectors rather than rasterized images, users can alter hues, saturation, and brightness globally or selectively within seconds. This capability transforms a generic template into a bespoke brand asset.
For marketers managing multiple campaigns or agencies handling various clients, this adaptability is essential. You are not locked into the designer’s original palette. Instead, the organized layers allow you to isolate specific components—such as background shapes, iconography, or connecting lines—and adjust them independently. This level of granular control ensures that the visual tone remains consistent across quarterly reports, social media carousels, and pitch decks without requiring custom illustration work for every new project.
Format Versatility Across Print and Digital Mediums
Professional workflows rarely exist in a single medium. A chart designed for a LinkedIn post may later be needed for a printed annual report or an embroidered corporate gift. The inclusion of multiple file formats addresses this cross-platform reality effectively. While many asset packs offer only basic PNGs, this collection provides a robust suite including AI, EPS, SVG, and CMX vectors alongside high-resolution JPG and PNG exports.
- Vector AI and EPS: These serve as the master files for Adobe Illustrator and CorelDRAW users, allowing for infinite resizing and deep editing without quality loss.
- SVG Format: Essential for web designers and developers, SVGs ensure crisp rendering on retina displays and allow for CSS-based animation or interaction directly in the browser.
- CMX Compatibility: The inclusion of CMX files is a notable distinction for CorelDRAW professionals, ensuring native compatibility without the conversion artifacts that sometimes occur when importing AI files.
- Transparent PNG and High-Res JPG: These provide immediate utility for non-designers or for quick mockups in PowerPoint, Keynote, or Canva, where vector editing is not possible or necessary.
This multi-format approach future-proofs the asset library. Users are not forced to upgrade software or learn new tools to utilize the content; they can simply select the file type that aligns with their current environment.
Organized Layers and Production Efficiency
A common frustration with downloaded design resources is poor file hygiene. Unnamed layers, grouped objects that cannot be ungrouped, and hidden clipping masks can turn a simple edit into a forensic investigation. The emphasis on organized layers in this Infographic Elements Design set suggests a production-ready mindset. When layers are logically named and structured, the time spent navigating the file decreases significantly.
For teams collaborating on shared drives or cloud platforms, this organization is vital. If a junior designer needs to update a statistic or swap an icon, they should be able to locate the correct layer immediately without guessing. Furthermore, the "print-ready" specification implies that bleed areas, color profiles, and resolution standards have been considered. This reduces the risk of costly printing errors or pixelated outputs in professional presentations. Reliability in asset structure is often undervalued until a deadline approaches; having clean, predictable source files is a tangible productivity multiplier.
Practical Applications and Audience Fit
While the term "infographic" suggests statistical charts, the utility of these 100 resizable vector shapes extends far beyond bar graphs and pie charts. The modular nature of the elements makes them suitable for a wide array of professional contexts:
- Corporate Reporting: Transforming dense financial tables into visual narratives for stakeholder meetings.
- Educational Content: Creating step-by-step process diagrams for training manuals or e-learning modules.
- Marketing Collateral: Designing feature comparison matrices for landing pages or sales brochures.
- Social Media Strategy: Building carousel slides that break down complex topics into swipeable visual chunks.
- Internal Communication: Visualizing organizational charts, timelines, or safety protocols for employee handbooks.
The target audience for this resource includes anyone who acts as a translator between data and people. Freelancers benefit from the reduced turnaround time, allowing them to take on more clients. Small business owners gain access to agency-quality visuals without the retainer cost. Educators and trainers can improve retention rates by replacing bullet points with visual models. However, it is worth noting that this tool is best suited for those who have at least a foundational understanding of vector software or are willing to use the provided raster versions. It is a force multiplier for existing skills, not necessarily a replacement for design thinking.
Assessing Long-Term Value and Limitations
When evaluating whether to integrate this Infographic Elements Design pack into your resource library, consider the balance between convenience and uniqueness. Pre-made elements inherently carry a risk of looking generic if used without modification. The ease of color changing and resizing helps mitigate this, but the user must still apply thoughtful layout and typography to create something distinctive. The 100 shapes provided are building blocks, not finished solutions.
Despite this caveat, the long-term value proposition is strong. Unlike subscription-based stock services where costs accumulate monthly, owning a perpetual license to a versatile vector library creates a permanent asset base. The ability to resize elements without degradation means the same purchase serves both a business card and a billboard. The transparent backgrounds facilitate layering over photography or colored gradients, increasing compositional freedom.
From a technical standpoint, users should verify their software version compatibility, particularly for AI and CMX files, to ensure seamless integration. While the files are described as print-ready, always double-check color modes (CMYK vs. RGB) before sending jobs to commercial printers, as screen colors can differ from press output. Ultimately, this collection represents a pragmatic investment for professionals who prioritize clarity and efficiency. It removes the technical barriers to visual communication, allowing creators to focus on the narrative and accuracy of their message rather than the mechanics of drawing a perfect circle or aligning a connector line. For those regularly tasked with making information accessible, the organizational and technical benefits of this asset pack align well with the demands of modern professional content creation.