Infographic Template V.11: Editable Vector Design
Visual communication often fails not because the data is flawed, but because the presentation lacks structure. Infographic Template V.11 addresses this specific friction point by providing a rigorous yet flexible framework for displaying complex information. Designed in a 16:9 aspect ratio, this template moves beyond standard vertical scrolling formats to accommodate modern presentation environments, video backgrounds, and wide-format digital displays. It serves as a foundational tool for professionals who need to translate raw statistics or processes into digestible visual narratives without spending hours building grids from scratch.
The true value of this asset lies in its balance between aesthetic consistency and functional adaptability. While many templates lock users into rigid color schemes or unchangeable iconography, Infographic Template V.11 is built as a living document. Whether you are a freelance designer meeting a tight deadline or an educator preparing lecture materials, the editable vector nature ensures that the design serves your content, rather than forcing your content to fit the design. This approach respects the intelligence of the audience and the expertise of the creator.
Technical Specifications and File Compatibility
Understanding what is inside the package is essential for integrating this template into a professional workflow. The download includes three distinct file types, each serving a specific purpose in the production pipeline. The Illustrator CC file acts as the primary source document. It contains fully organized layers, named groups, and unlocked vector paths. This organization is critical; it allows you to isolate specific infographic elements, swap icons, or adjust typography without accidentally disrupting adjacent layout components. For teams working across different software versions or collaborating with external vendors, the EPS 10 file provides backward compatibility while retaining full vector scalability. Finally, the Preview JPEG serves as a quick reference guide, allowing you to verify layout options before opening heavy vector files.
The 16:9 aspect ratio is a deliberate choice that aligns with current media consumption standards. Unlike A4 or tall-scroll infographics, this format fits perfectly on:
- PowerPoint and Keynote slides without cropping or letterboxing
- YouTube thumbnails and video end-screens
- LinkedIn landscape posts and Facebook link previews
- Digital signage and conference display monitors
- Embedded website headers and hero sections
Adapting the Layout for Diverse Content Types
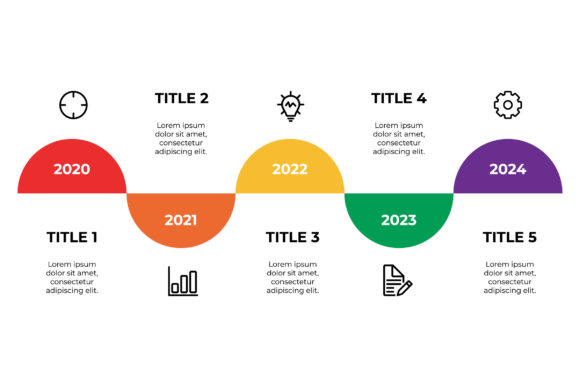
Infographic Template V.11 is not limited to a single style of data visualization. Its modular construction supports various narrative structures. When approaching a new project, consider how the underlying grid can support your specific message. For chronological data, such as company history or project roadmaps, the horizontal flow inherent in the 16:9 ratio naturally guides the eye from left to right. You can anchor key milestones along a central axis while using upper and lower quadrants for supporting details or context.
For comparative analysis, split the canvas vertically down the center. Use contrasting colors to differentiate between two products, services, or concepts, but maintain consistent spacing and alignment to ensure the comparison feels fair and objective. The vector elements can be resized proportionally to emphasize differences in scale or performance metrics. If your goal is to explain a cyclical process or ecosystem, utilize the corner anchor points to create a rotational flow that keeps the viewer’s attention centered on the core concept.
Strategic Applications for Marketers and Educators
Different audiences require different levels of cognitive load. Marketers using Infographic Template V.11 should focus on high-impact visuals and minimal text. In advertising or social media contexts, the template functions best as a "scroll stopper." Replace dense paragraphs with bold headlines and simplified charts. The 16:9 format is particularly effective for carousel ads where each slide reveals a new segment of the template, creating a seamless panoramic effect when swiped.
Educators and trainers, conversely, often need higher information density. Here, the template acts as a teaching aid rather than a marketing hook. Utilize the editable text areas to include definitions, citations, or step-by-step instructions. Because the file is vector-based, you can zoom in during live presentations to highlight specific details without pixelation. The clean lines and ample whitespace prevent cognitive overload, helping students retain information more effectively than they would from a cluttered slide deck.
Maintaining Visual Hierarchy and Clarity
Having an editable template does not automatically guarantee good design. Effective use of Infographic Template V.11 requires discipline in maintaining visual hierarchy. Just because you can fill every section with content does not mean you should. Negative space is an active design element that directs attention and improves readability. When customizing the template, resist the urge to increase font sizes or add decorative elements unless they serve a functional purpose.
Consistency builds trust. Establish a strict style guide before modifying the vector assets. Define your color palette, limit your typefaces to two complementary families, and standardize your icon stroke weights. If the original template uses line-art icons, do not mix them with filled glyphs or 3D renders. This visual coherence signals professionalism and helps the audience navigate the information intuitively. When replacing placeholder text, ensure that headings remain distinct from body copy through size, weight, or color contrast. Accessibility should also be a priority; verify that text-to-background contrast ratios meet WCAG standards, especially when adapting the template for public-facing digital platforms.
Creative Variations and Customization Techniques
To make Infographic Template V.11 truly your own, look beyond simple color swaps. Experiment with masking and clipping paths to integrate photography within the geometric shapes. This hybrid approach softens the clinical feel of pure vector art and adds human warmth to corporate or technical topics. You might also explore texture overlays to give the flat design a tactile quality, making it stand out in a sea of generic minimalist graphics.
Consider breaking the frame. While the 16:9 boundary defines the safe area for presentations, elements that intentionally bleed off the edge can create a sense of dynamism and expansion. This technique works exceptionally well for web banners or print posters derived from the digital master. Additionally, leverage the layer structure to create animation-ready assets. By keeping moving parts on separate layers, you can easily export individual components for motion graphics in After Effects or CSS animations for web development.
Practical Workflow Recommendations
Efficiency is the hallmark of professional creative work. Before diving into customization, audit your content. Map out your data points and narrative flow on paper first. Knowing exactly what needs to go where prevents aimless tweaking of vector nodes. When editing the Illustrator CC file, use global swatches for colors. This allows you to rebrand the entire infographic with a single click rather than selecting objects individually. Save iterative versions of your file to preserve previous layout states; sometimes a later variation loses the clarity of an earlier draft.
Finally, always test your output in context. An infographic that looks perfect at 100% zoom in Illustrator may become illegible when scaled down for a mobile screen or embedded in an email newsletter. Export test renders at actual display sizes to verify legibility. Check how the 16:9 ratio interacts with platform-specific UI overlays, such as YouTube progress bars or Instagram caption truncation. By validating the design against real-world constraints, you ensure that Infographic Template V.11 delivers not just aesthetic appeal, but genuine communicative utility.
This template represents more than a collection of vectors; it is a system for thinking visually. By respecting its structural logic while injecting your unique content and brand identity, you transform a generic asset into a powerful communication tool. Whether clarifying a complex dataset for stakeholders or inspiring an audience with a compelling story, the combination of editable precision and widescreen versatility makes this package an indispensable resource for modern creators.