Infographic Template V.8: Editable Vector Design
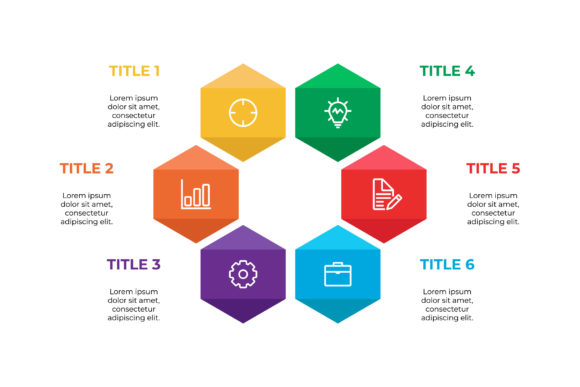
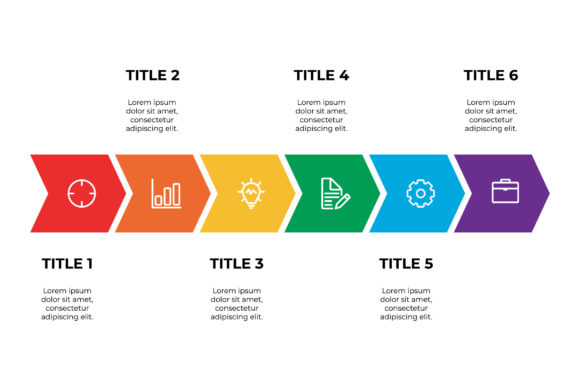
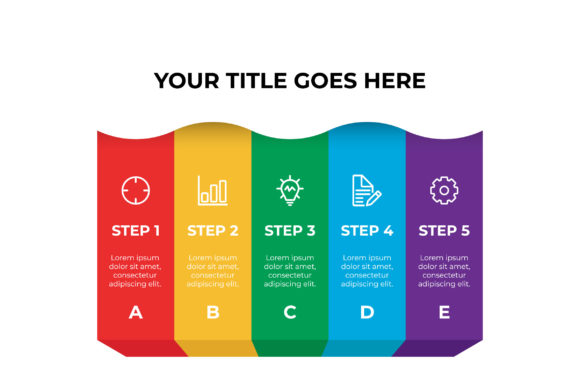
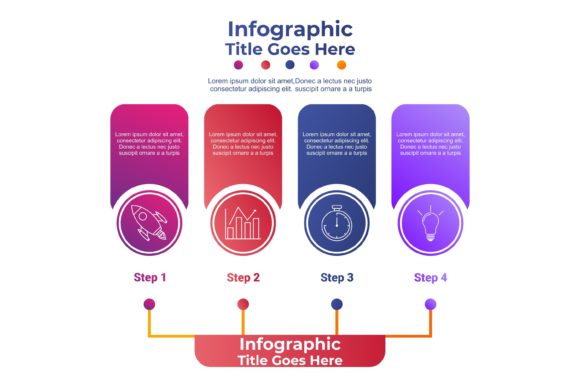
Creating high-impact visual content often requires a balance between professional design standards and practical efficiency. Infographic Template V.8 addresses this need by providing a structured, fully editable vector framework optimized for modern digital communication. This template is specifically engineered with a 16:9 aspect ratio, making it immediately suitable for presentation slides, video backgrounds, YouTube thumbnails, and widescreen digital displays without the need for cropping or resizing. For professionals who need to convey complex data or narratives quickly, having a pre-structured layout that maintains visual integrity across platforms is a significant operational advantage.
The value of this resource lies in its technical flexibility and ease of customization. Unlike raster-based templates that degrade when scaled or modified, Infographic Template V.8 is built entirely on vector paths. This means every shape, line, and icon can be resized infinitely without pixelation. More importantly, the text elements are fully editable, allowing users to adapt the messaging to their specific audience without requiring advanced graphic design skills. Whether you are a marketer updating quarterly metrics or an educator explaining a historical timeline, the ability to modify content directly within the file structure streamlines the production workflow considerably.
Optimizing Visual Communication with 16:9 Format
The decision to utilize a 16:9 aspect ratio for Infographic Template V.8 reflects current consumption habits across digital media. While traditional infographics often use tall, vertical layouts suited for Pinterest or blog scrolling, the widescreen format serves a different strategic purpose. It aligns perfectly with standard slide decks in PowerPoint and Keynote, ensuring that your infographic integrates seamlessly into corporate presentations or academic lectures. This eliminates the awkward white space or distorted proportions that often occur when forcing vertical graphics onto horizontal screens.
For content creators and video producers, this aspect ratio is equally valuable. The template can serve as a foundational layer for motion graphics or as a static title card in video essays. Because the composition is designed for landscape viewing, information flows laterally, which matches the natural eye movement of viewers watching screens. This lateral flow is particularly effective for process diagrams, timelines, and comparative analyses where sequential logic matters. By adopting this format, users can repurpose a single asset across multiple channels—from LinkedIn posts to webinar visuals—maximizing the return on time invested in content creation.
Technical Specifications and File Compatibility
Understanding what is included in the package is essential for determining workflow compatibility. This template package provides three distinct file types to accommodate various software environments and user expertise levels:
- Illustrator CC File: This is the primary source file, offering full access to layers, artboards, and vector editing tools. Users with Adobe Illustrator CC can modify colors, typography, and structural elements with complete freedom. This file preserves all smart objects and linked assets, ensuring the highest quality output for print or digital publication.
- EPS 10 File: Designed for broader compatibility, the EPS 10 format ensures that users with older versions of Illustrator or alternative vector software like CorelDRAW or Affinity Designer can still open and edit the template. While some newer effects may be flattened in this format, the core vector paths and editable text remain accessible, making it a reliable fallback option.
- Preview JPEG: A high-resolution raster image serves as a visual reference. This allows users to verify the design before opening heavy vector files and provides a ready-to-use asset for quick mockups or draft approvals when final editing is not yet required.
This multi-format approach reduces friction in collaborative environments. A senior designer might work in the CC file to establish brand guidelines, while a junior associate uses the EPS version to update specific data points. Meanwhile, stakeholders can review the JPEG preview without needing specialized software installed on their devices.
Practical Applications for Professionals and Creators
Infographic Template V.8 is most effective when applied to scenarios that demand clarity and speed. Business analysts and consultants frequently face the challenge of translating dense spreadsheets into digestible insights. With editable text fields and modular chart components, this template allows for rapid iteration during stakeholder meetings. Instead of spending hours designing a custom visualization from scratch, professionals can focus on refining the narrative and ensuring data accuracy. The clean, modern aesthetic also helps maintain credibility, as polished visuals are often subconsciously associated with rigorous analysis.
Educators and trainers benefit similarly from the template’s structured layout. Complex concepts such as scientific processes, organizational hierarchies, or literary structures become more accessible when presented visually. The 16:9 format fits classroom projectors and learning management systems natively. Because the text is editable, instructors can tailor vocabulary and examples to different grade levels or language proficiencies without redesigning the entire graphic. This adaptability supports inclusive teaching practices and reduces preparation time for course materials.
Small business owners and freelancers often lack dedicated design resources but still need professional-grade marketing collateral. Infographic Template V.8 bridges this gap by providing agency-quality aesthetics at a fraction of the cost. Whether creating a service comparison chart for a website or a feature breakdown for a product launch, the template offers a consistent visual language that strengthens brand recognition. The vector nature of the files means the same asset can be printed on a brochure or displayed on a retina screen with equal sharpness, eliminating the need to create separate versions for different media.
Customization Best Practices and Considerations
While Infographic Template V.8 is designed for ease of use, achieving optimal results requires thoughtful customization. Simply replacing placeholder text without considering hierarchy can undermine the design’s effectiveness. Users should pay attention to font weights and color contrast to ensure readability, especially when presenting on projected screens where visibility may vary. Maintaining adequate whitespace around text blocks prevents visual clutter and guides the viewer’s attention through the intended narrative sequence.
It is also important to recognize the template’s limitations. As a pre-designed framework, it works best for standard information architectures like lists, cycles, or linear processes. Highly specialized data visualizations, such as geospatial maps or complex network graphs, may require additional custom illustration beyond what the template provides. Users should evaluate whether their content fits the existing structural modules before committing to this format. If the data story requires breaking the grid significantly, starting from scratch or combining multiple templates might yield better results than forcing content into an incompatible layout.
Color management is another practical consideration. The template likely uses CMYK or RGB color profiles depending on its primary intended use. Before finalizing files for print, users should verify color modes to avoid unexpected shifts in hue. Similarly, when using custom fonts not included in the package, ensuring proper licensing and embedding permissions is necessary to maintain compliance and cross-platform consistency. These technical details, while minor, distinguish professional outputs from amateur adaptations.
Enhancing Workflow Efficiency and Creative Consistency
Beyond individual projects, Infographic Template V.8 supports broader organizational efficiency. Teams that adopt standardized templates reduce cognitive load during the design process. When everyone uses the same foundational assets, reviewing and providing feedback becomes faster because reviewers understand the underlying structure. This consistency also accelerates onboarding for new team members, who can learn one system rather than adapting to disparate design styles across different departments.
For solo creators and entrepreneurs, the template serves as a creative catalyst rather than a constraint. Having a proven layout removes the paralysis of the blank canvas, allowing creative energy to focus on content strategy and messaging. The modular nature encourages experimentation; users can duplicate, rearrange, or hide sections to test different information flows without rebuilding the design each time. This iterative capability is invaluable for A/B testing visual content or adapting evergreen assets for seasonal campaigns.
Ultimately, the utility of Infographic Template V.8 stems from its role as a professional tool rather than mere decoration. It solves specific problems related to format compatibility, editing efficiency, and visual consistency. By providing editable vector files in both CC and EPS formats alongside a 16:9 aspect ratio, it meets the practical demands of modern multi-channel communication. Users who approach it with clear objectives and attention to detail will find it significantly reduces production time while elevating the quality of their visual storytelling. The investment in such a template pays dividends not just in saved hours, but in clearer communication and more effective audience engagement across diverse professional contexts.