Infographic Template Vol.20: Visual Workflow Design
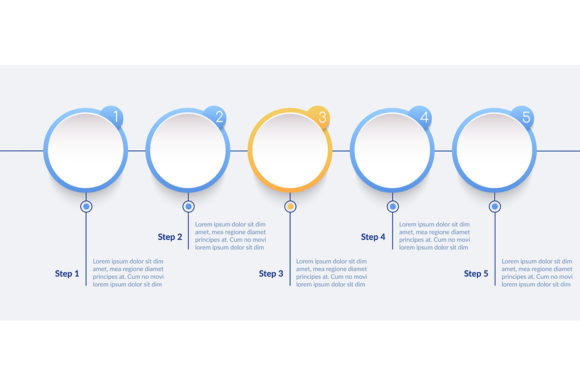
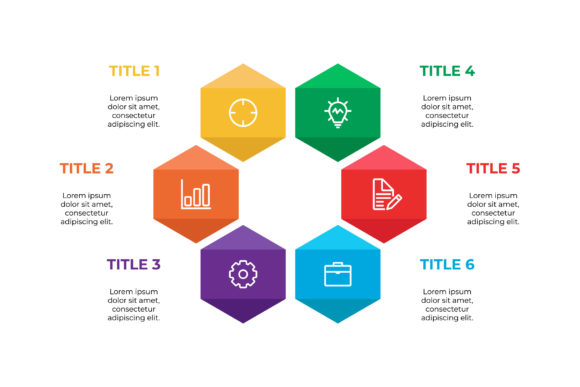
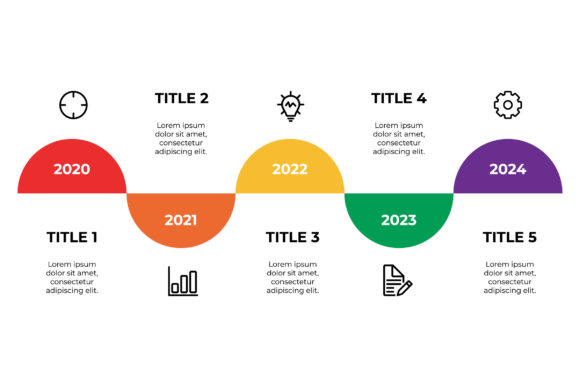
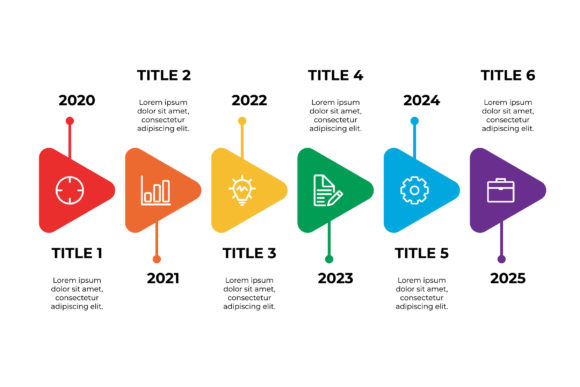
Effective visual communication often hinges on the ability to simplify complexity without losing nuance. Infographic Template Vol.20 addresses this specific challenge by providing a structured yet flexible framework for presenting data, workflows, and product details. Unlike generic layouts that force content into rigid boxes, this template collection is designed with a modular personality that adapts to the narrative you need to tell. Its visual character strikes a balance between professional authority and creative accessibility, making it suitable for everything from technical diagrams to engaging social media banners.
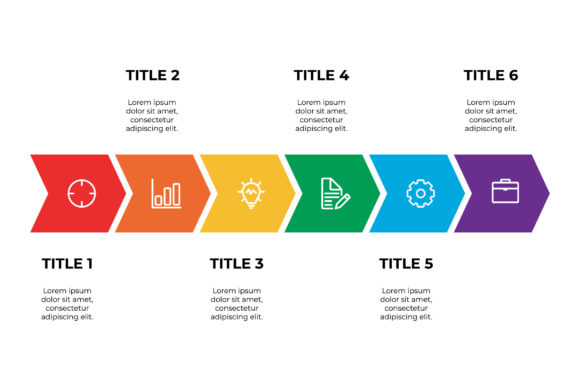
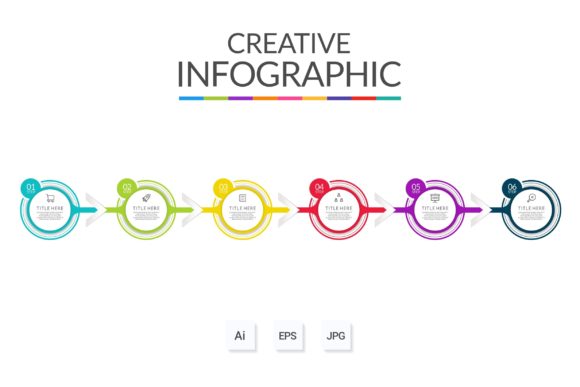
The aesthetic of Vol.20 leans toward modern clarity. It avoids excessive ornamentation in favor of clean lines, ample negative space, and intuitive flow. This design philosophy ensures that the viewer’s eye is guided naturally through the information hierarchy rather than getting stuck on decorative elements. For designers and marketers, this means the template acts as a sophisticated container for your brand identity rather than competing with it. Whether you are outlining a SaaS user journey or explaining a handmade crafting process, the underlying grid system supports readability and retention.
Strategic Applications Across Digital and Print Media
Versatility is the primary strength of this asset. While labeled as an infographic template, its utility extends far beyond static data visualization. The organized layer structure makes it an exceptional foundation for web design sections, particularly for "How It Works" pages or feature breakdowns on landing pages. In digital environments, where attention spans are fragmented, the clear visual segmentation found in Vol.20 helps reduce cognitive load. Users can scan the layout and grasp the core message within seconds, which is essential for reducing bounce rates and improving engagement metrics.
For print and editorial projects, the template translates seamlessly into brochures, annual reports, and instructional guides. The vector-based nature of the Main AI and EPS files ensures that typography and shapes remain crisp at any scale. Publishers and content creators often struggle with maintaining consistency across multi-page documents; using a unified template system like this establishes a visual rhythm that ties disparate sections together. It also serves as an excellent banner format for event signage or trade show displays, where large-format legibility is non-negotiable.
Entrepreneurs and small business owners will find particular value in repurposing these layouts for pitch decks and investor presentations. A well-structured diagram communicates competence and organizational thinking. Instead of spending hours aligning shapes in presentation software, you can leverage the pre-built workflow layouts to focus entirely on refining your value proposition. This efficiency allows non-designers to produce agency-quality visuals that enhance brand perception and stakeholder confidence.
Typography and Readability in Information Design
A template is only as effective as the typography it employs or accommodates. Infographic Template Vol.20 is optimized for modern sans serif typefaces, which are industry standards for UI/UX and informational graphics due to their screen readability and neutral tone. However, the layout’s generous spacing allows for experimentation with font pairing. If your brand identity relies on a distinctive serif or script font for headers, the template provides enough breathing room to prevent the design from feeling cluttered when combined with body text.
When customizing the text, prioritize hierarchy over decoration. The template includes designated areas for headlines, subheads, and supporting copy. Respecting this structure is crucial for maintaining visual flow. Changing the text is simple, but replacing a concise label with a paragraph of dense copy will break the layout’s rhythm. Edit your content to fit the visual container, or adjust the container size if the information density requires it. This discipline ensures that the final output remains scannable and user-friendly.
Accessibility should also guide your typographic choices within this template. Ensure sufficient contrast between text and background colors, especially when modifying the color palette to match your brand. While the template provides a stylish starting point, WCAG compliance is your responsibility during customization. Testing your modified version on different screens and in grayscale can reveal potential readability issues before publication. Good design is inclusive design, and Vol.20’s clean architecture makes achieving accessibility standards more straightforward than with heavily textured alternatives.
Maximizing Value Through Organized Asset Management
The technical construction of Infographic Template Vol.20 directly impacts your production speed. The promise that "everything is layered and organized" is not merely a convenience feature; it is a workflow accelerator. In professional design environments, time spent hunting for specific elements or unlocking grouped layers is non-billable friction. This template mitigates that friction through logical naming conventions and group structures. You can isolate specific diagram components, swap icons, or adjust color schemes globally without risking accidental changes to unrelated elements.
The inclusion of both Main AI and Main EPS files ensures compatibility across different software versions and workflows. Adobe Illustrator users will appreciate the native editing capabilities, while those using alternative vector software or older versions can rely on the EPS format. This cross-platform flexibility is vital for teams with mixed toolsets or for freelancers delivering source files to clients with varying technical setups. Additionally, the use of free fonts eliminates licensing headaches. You can deploy the template commercially without auditing font licenses or purchasing additional assets, streamlining the path from concept to delivery.
Practical Customization Guidelines
To get the most out of this template, approach modification with a systematic mindset. Start by defining your color palette and applying it via global swatches rather than selecting individual objects. This maintains consistency and allows for rapid iteration if client feedback demands a tonal shift. When adapting the workflow layout for a new context, consider the directional flow of information. Western audiences read left-to-right and top-to-bottom; ensure your diagram follows this natural path unless there is a strategic reason to disrupt it.
- Evaluate Content Density: Before opening the file, audit your text. If you have significantly more content than the placeholder, consider splitting the information across two template variations rather than shrinking font sizes to illegibility.
- Maintain Visual Weight: When removing elements to simplify a diagram, ensure the remaining composition feels balanced. Use alignment tools to redistribute space evenly so the design doesn't appear lopsided.
- Test Icon Consistency: If you replace included icons with custom brand assets, verify that stroke weights and stylistic details match the existing template aesthetic. Mismatched iconography creates visual dissonance that undermines professionalism.
- Export for Intent: Utilize the AI file for further editing and high-resolution print outputs. For web use, export optimized SVGs or PNGs to maintain sharpness on retina displays while managing file size.
Ultimately, Infographic Template Vol.20 serves as a bridge between raw data and compelling storytelling. It removes the technical barriers to creating sophisticated visual content, allowing designers, marketers, and business owners to focus on message clarity and audience connection. By leveraging its organized structure and adaptable style, you transform routine information exchange into an engaging brand experience that resonates across platforms and mediums.